Translational selection and yeast proteome evolution
Amino acid altering mutations could affect an organism’s fitness through physiological effects that are independent of their effects on protein function. Although individual amino acid mutations are likely to have small effects on overall cell physiology, global evolutionary forces could underlie proteome-wide patterns of amino acid composition as well as variation in rates of protein evolution. In this project, the Saccharomyces cerevisiae genome sequence, DNA microarray expression data, tRNA gene numbers, and functional categorizations of proteins were employed to determine whether the amino acid composition of peptides reflects natural selection to optimize the speed and accuracy of translation.
Among microbes, as well as multicellular eukaryotes, synonymous codon usage is co-adapted with tRNA pools to enhance the efficiency of protein synthesis (reviewed in Akashi 2001). Differences in cellular concentrations or codon-anticodon stability could lead to translation selection both within and among synonymous families. Usage of several amino acids show associations with gene expression (Figure 1), and changes in amino acid composition result in stronger correlations between amino acid usage and tRNA abundances in highly expressed genes than in less expressed loci (figure 2, 3). Similar relationships within protein functional categories support that the primary structures of proteins reflect natural selection to enhance the rate and accuracy of their synthesis. Selection for efficient biosynthesis may also constrain protein size; among proteins in the same broad functional category, proteins encoded by highly expressed genes are consistently smaller than those encoded by less expressed loci.
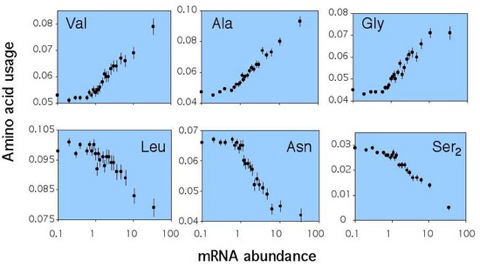
Figure 1. Transcript abundance and amino acid usage.
Data are graphed for expression categories (bin sizes é5x10⁴ codons). Abundances are among all codons.
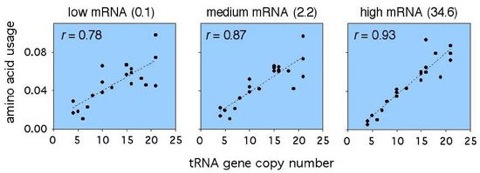
Figure 2. Correlations between amino acid usage and tRNA gene copy numbers.
RNA gene copy numbers from Percudani et al. (1997). The numbers are pooled among genes encoding isoacceptors for each amino acid.
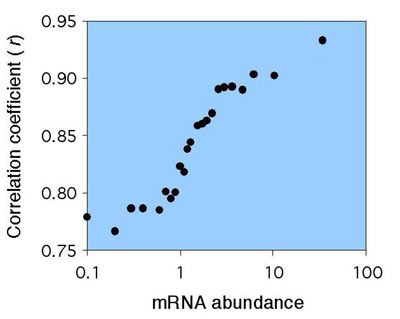
Figure 3. Correlations between amino acid usage and tRNA gene copy numbers among expression classes.
Data are graphed for expression categories (bin sizes é5x10⁴ codons). Pearson product moment correlation coefficients between tRNA gene copy numbers and amino acid usage are plotted on the y-axis.
References
- Gene expression and molecular evolution
- Curr Opin Genet Dev 11:660–666. 2001.
- Translational selection and yeast proteome evolution
- Genetics 164:1291–1303. 2003.
- Transfer RNA gene redundancy and translational selection in Saccharomyces cerevisiae
- J Mol Biol 268: 322-330. 1997.