Metabolic economics and bacterial proteome evolution
Natural selection is thought to act upon protein structures to optimize biochemical properties (activity, stability, and specificity) related to their specific cellular function. Selection pressures related to efficient synthesis, rather than proper function, of proteins may act globally on the amino acid composition of the proteome, but are less firmly established.
A substantial fraction of the energy budget of bacteria is devoted to biosynthesis of amino acids, the building blocks of proteins. The fueling reactions of central metabolism provide precursor metabolites for synthesis of the 20 amino acids incorporated into proteins. Thus, synthesis of an amino acid entails a dual cost; energy is lost by diverting chemical intermediates from fueling reactions and additional energy is required to convert precursor metabolites to amino acids. The range of costs of biosynthesis vary from 11 ATP equivalents per molecule of Glycine, Alanine, and Serine to over 70 ATP per molecule of Tryptophan.
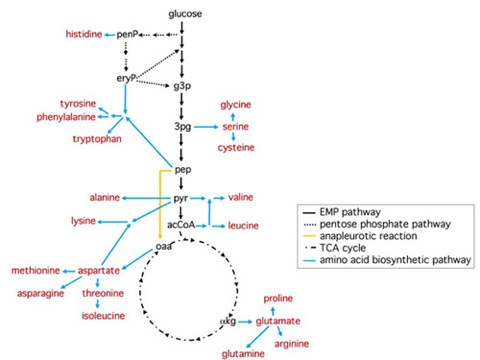
Figure 1. Fueling reactions and amino acid biosynthetic pathways in E. coli
Fueling reactions and amino acid biosynthetic pathways are shown as black and blue arrows, respectively. The major anapleurotic pathway, which replenishes oaa in the TCA cycle, is shown in yellow.
If energy is limiting to survival or reproduction, then the amino acid composition of proteins encoded in the genome should be biased toward less energetically costly molecules. The extent to which amino acid composition is biased to reduce metabolic costs should be a positive function of gene expression levels, or the numbers of proteins synthesized from each gene. Figure 2 shows striking correlations between average costs of biosynthesis and major codon usage (a proxy for gene expression levels) in the genomes of E. coli and B. subtilis. Such correlations exist within functional categories of proteins and within groups of exchangeable amino acids, suggesting that the primary structures of proteins reflect natural selection for efficient biosynthesis as well as proper function.
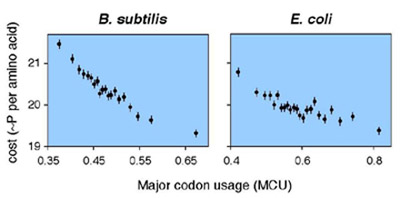
Figure 2. Correlations between energetic costs and major codon usage in B. subtilis and E. coli genes
(A) and (B) plot the average cost per amino acid and average MCU for bins of genes from the B. subtilis and E. coli genomes, respectively. Genes were ranked by MCU and data were pooled from low to high MCU values until 50,000 codons was reached for each bin. 95% confidence intervals on the estimates of mean costs are shown.
References
- Gene expression and molecular evolution
- Curr Opin Genet Dev 11:660–666. 2001.
- Metabolic efficiency and amino acid composition in the proteomes of Escherichia coli and Bacillus subtilis
- Proc. Natl. Acad. Sci., USA. 99: 3695-3700. 2002.